Prometheus pushgateway 代理(5)
上一节 Prometheus alertmanager 告警(4)
介绍
Pushgateway是 Prometheus 生态中一个重要工具。因 Prometheus 采用 pull 模式,可能由于网络或跨域问题,导致 Prometheus 无法直接拉取各个主机 target 数据。因此可push数据到 Pushgateway 然后 Prometheus 在从 Pushgateway pull 数据,从而获取数据统一到 Prometheus 中。 但使用 Pushgateway 也有弊端,如下:
将多个节点数据汇总到 Pushgateway, 如果 Pushgateway 挂了,受影响比多个 target 大。
Prometheus 拉取状态 up 只针对 Pushgateway, 无法做到对每个节点有效(可通过插件解决)。
Pushgateway 可以持久化推送给它的所有监控数据,因此如果监控已经下线,Prometheus 还会拉取到旧的数据,这里需要手动清理 Pushgateway 数据。
拓扑
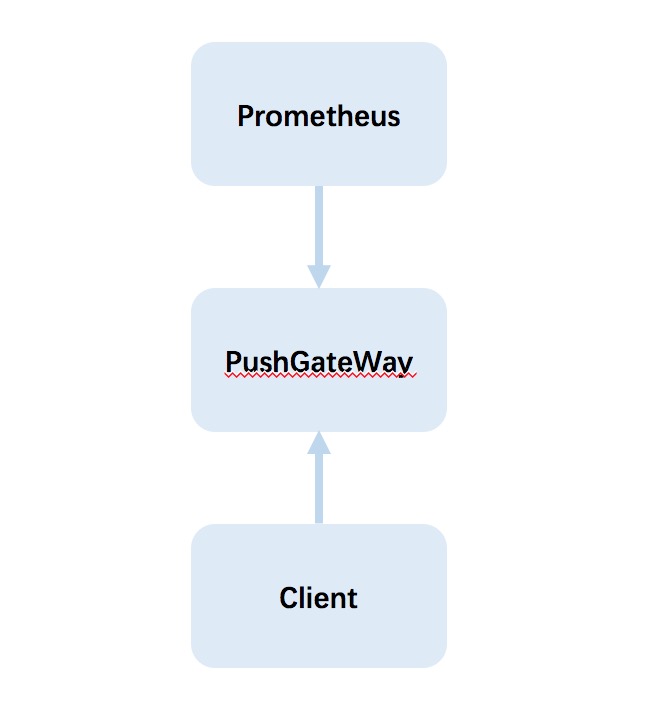
Client 可以是一个脚本、daemon程序、业务推送(定时push数据到Pushgateway)
安装
https://prometheus.io/download/ (找到对应系统的最新版本)
cd /data/pushgateway
wget https://github.com/prometheus/pushgateway/releases/download/v0.8.0/pushgateway-0.8.0.linux-amd64.tar.gz
tar -zxvf pushgateway-0.8.0.linux-amd64.tar.gz

# 启动
./bin/pushgateway >logs/app.log 2>&1 &
启动后,可以访问http://127.0.0.1:9091/ 看push上来的数据
配置 Prometheus
vim prometheus.yml
# 加如下配置

- job_name: 'push_node'
    static_configs:
    - targets: ['192.168.10.9:9091']
      labels:
         env: 'pushgateway'
    honor_labels: true
重新加载配置,访问http://127.0.0.1:9090/service-discovery 查看新加的push_node
Prometheus提供4种类型Metrics
Counter:可增长,并且在程序重启的时候会被重设为0,常被用于任务个数,总处理时间,错误个数等只增不减的指标。
Gauge:Gauge与Counter类似,唯一不同的是Gauge数值可以减少,常被用于温度、利用率等指标。
Summary:摘要和Histogram柱状图比较类似,主要用于计算在一定时间窗口范围内度量指标对象的总数以及所有对量指标值的总和。
Histogram:这个比较像柱状图,更多的是用于统计一些数据分布的情况,用于计算在一定范围内的分布情况,同时还提供了度量指标值的总和。
数据上报
通常情况下,我们可以使用官方提供的Client上报数据。https://prometheus.io/docs/instrumenting/clientlibs/, 但也可以使用Pushgateway 提供的 API 操作数据。
https://github.com/prometheus/pushgateway (github上有具体使用方法)
示例1
# 名称 nginx_http 值 1 为 真 0 为 否, job 可是配置文件中的,也可以自定义
echo "nginx_http 1" | curl --data-binary @- http://127.0.0.1:9091/metrics/job/push_node
示例2
在 示例1 指标上报的 instance 是 Pushgateway 的地址,可以指定 instance 上报数据
cat <<EOF | curl --data-binary @- http://127.0.0.1:9091/metrics/job/push_node/instance/192.168.10.10
# TYPE nginx_http counter
nginx_http{label="dev"} 42
# TYPE nginx_https gauge
# HELP nginx_https Just an example.
nginx_https{label="dev"} 1
EOF
示例3
因Pushgateway会持久化上报数据,当某台主机下线后,旧的数据任然存在,所以需要手动清理掉
# 删除某个 job 下的 某个 instance
curl -X DELETE http://127.0.0.1:9091/metrics/job/push_node/instance/192.168.10.10
总结
可以发现 Pushgateway 中的数据是按照 job 和 instance 分组分类,所以这两个参数不可缺少。
因为 Prometheus 配置 Pushgateway 的时候,也会指定 job 和 instance, 但是它只表示 Pushgateway 实例,不能真正表达收集数据的含义。所以在 Prometheus 中配置 Pushgateway 的时候,需要添加 honor_labels: true 参数, 从而避免收集数据本身的 job 和 instance 被覆盖。